Interact with data

Variable to display can be selected at the top of the left panel in Variable section.
Colormap
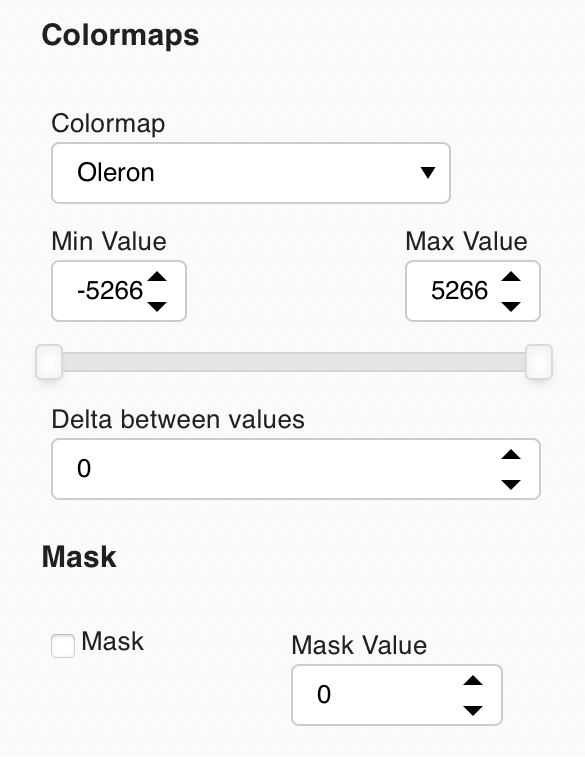
Options on colormap can be set in the left panel in Colormaps section.

Min and max values can be defined. Anything below the minimum value will appear light gray and anything above the maximum value will appear black.
Next, the number of color steps in the colormap can be also set.
Finally a mask can be applied, this colors values below the cutoff to gray and above the cutoff to black.
Graph tools

At the top right corner of the figure panel are a collections of tools, from left to right these are:
- Box selection
- Lasso selection
- Pan
- Box Zoom
- Mouse Scroll
- Save images
- Refresh / reset all graphs to initial zoom
- Hover (Display information when hovering data with the mouse)
Selection
As mentioned, in order to change the values of the data, the user can select data in two different ways:
- lasso tool (hand-drawn area)
- box selection (squared area)


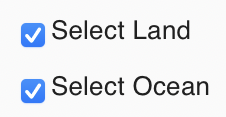
Then selection can be refined by ticking/unticking boxes in the Change Values section in the left panel:

Apply new values

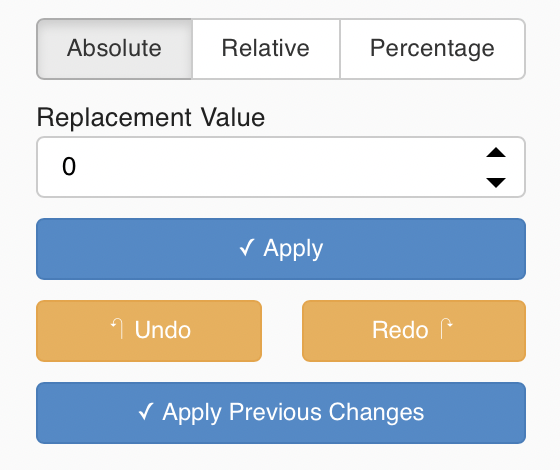
After point(s) have been selected on the graphs the user has the possibility to change the values in three different ways by using buttons in the Change Values section in the left panel.
If we consider the value in the Replacement Value field = X_value:
- Absolute (
New_value = X_value) - Relative (
New_value = base_value + X_value) - Percentage (
New_value = base_value + base_value * X_value %➞X_valuein Replacement Value field refers to a percentage)
Apply button can then be clicked to confirm changes. User can also choose to Undo or Redo changes he has made.
Save
Once all the changes have been done, the Save button can be clicked at the bottom of the figure panel to confirm changes and return to the main page.