Visu CM5A2
These scripts allow to visualize CM5A2 outputs. Plot are customizable with the ability to use custom colormap, add contour lines, etc… For more details you can check the header of each script which will explain all the inputs necessary (their format, specificities, etc…).
Environment
Depending on where you run the scripts you will have to install the environment accordingly:
On IRENE
Scripts are available on IRENE: /ccc/work/cont003/gen2212/gen2212/utils_CM5A2/visu_CM5A2/
To load the right environment:
. load_env.sh
On a local machine
Scripts are available on GitHub
- You can either install environment from the
environment.ymlfile located in the repository:conda env create -f /absolute/path/to/.../image_montage/environment.yml -
Or you can install the following conda environment:
Create environment:
conda create -n  env_name python=3.9
conda activate env_name
Install following packages:
conda install anaconda::ipykernel
conda install conda-forge::matplotlib
conda install conda-forge::cartopy
conda install conda-forge::xarray
conda install conda-forge::netcdf4
conda install conda-forge::h5netcdf
conda install conda-forge::sqlite
Processing scripts
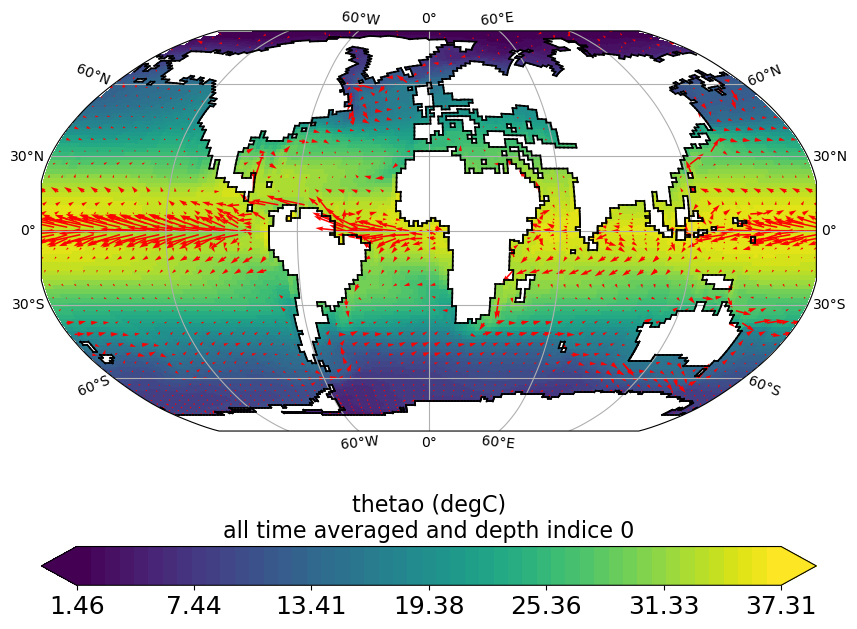
horizontal_section_plot.py
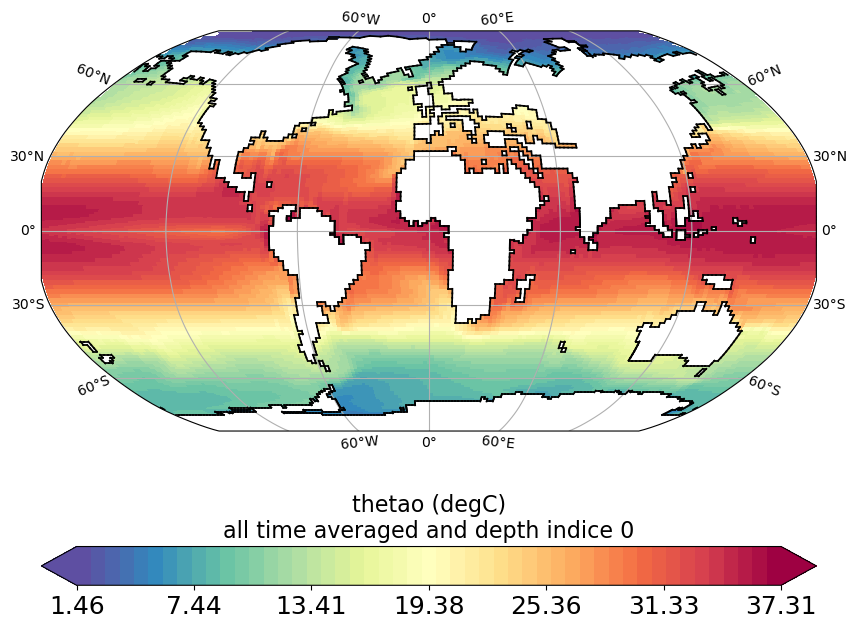
Plot horizontal section (lon/lat plot) of variable from CM5A2 output file (grid_T, ptrc_T, diad_T, …). Variable can be plotted for specific time step or time averaged over specific period and at specific depth or depth integrated over specific depths range.
horizontal_section_current_arrow_plot.py
Same as horizontal_section_plot.py but adds current arrows (using grid_U and grid_V files) on top of plot.
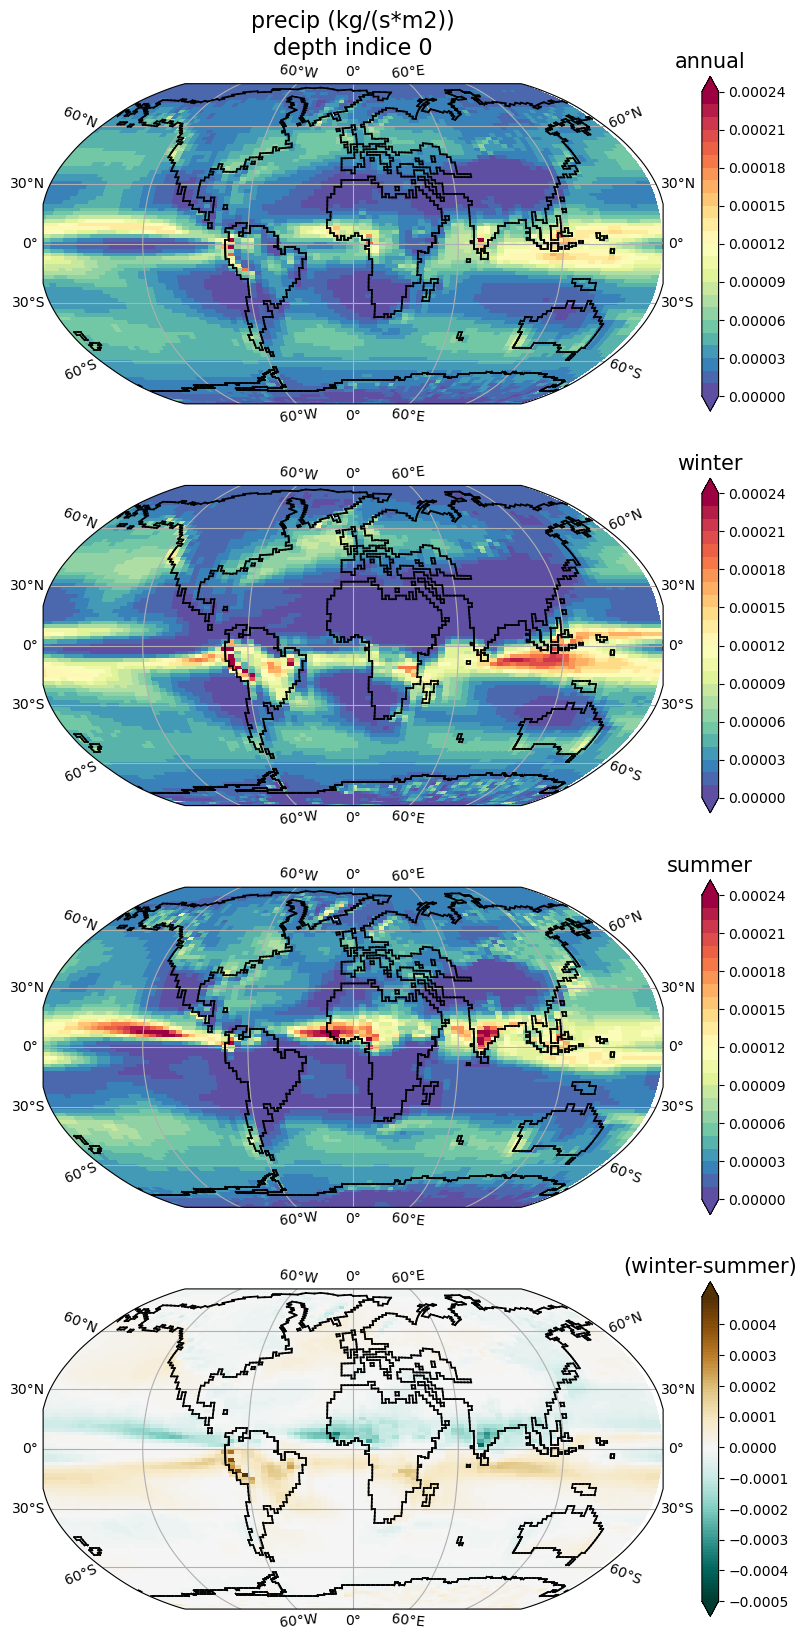
horizontal_section_plot_seasonnal.py
Same as horizontal_section_plot.py but creates 4 plots.
The first 3 plots are averages: annual, winter(jan-mar), summer (jul-sep).
The 4th plot is difference: winter-summer.
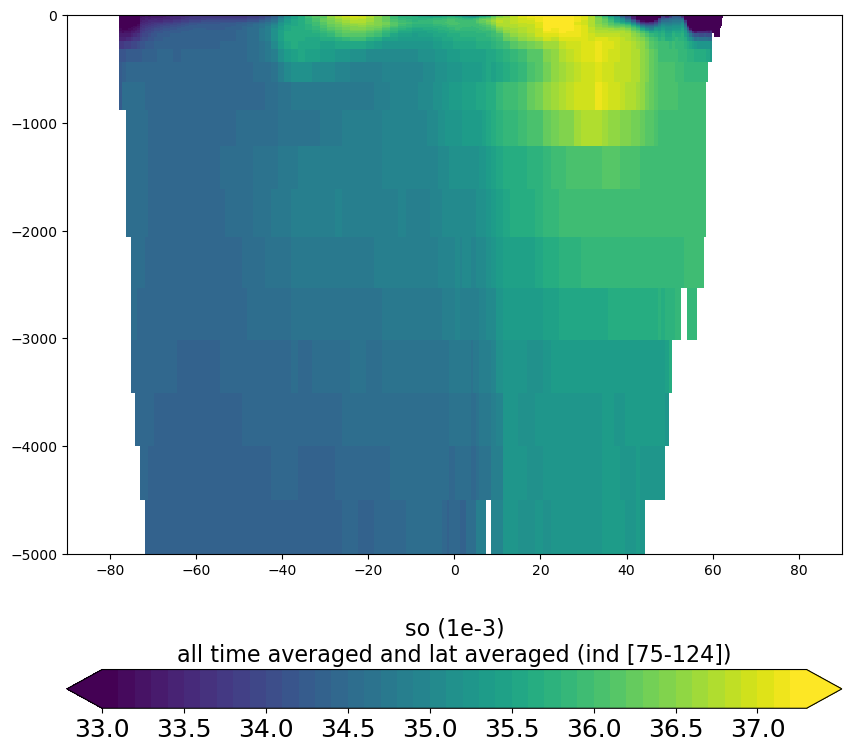
vertical_section_plot.py
Plot vertical section (lon or lat /depth plot) of variable from CM5A2 output file (grid_T, ptrc_T, diad_T, …). Variable can be plotted for specific time step or time averaged over specific period and at specific lon/lat slice or averaged over specific lon/lat ranges. Subbasin mask can be applied.
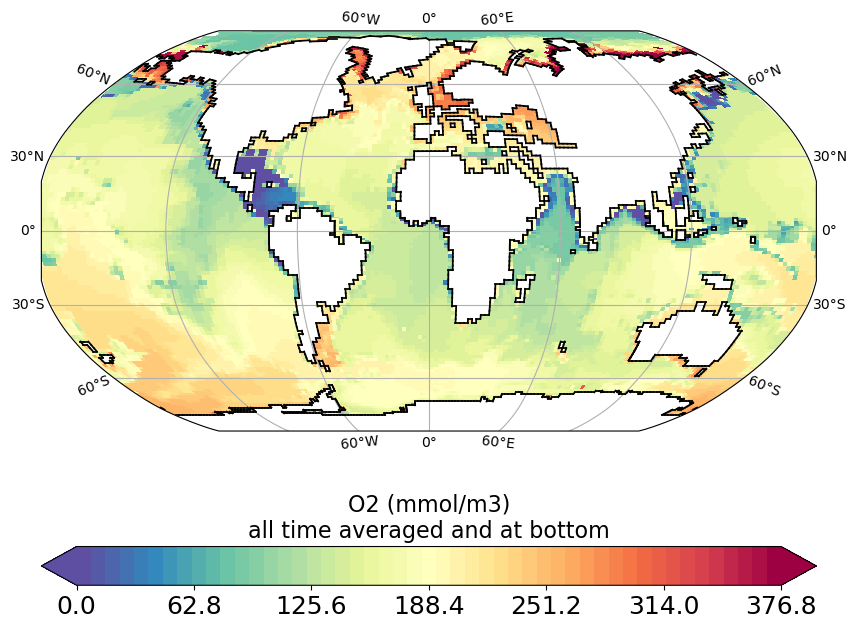
O2_bottom_plot.py
Gather O2 variable from ptrc_T file at deepest cell over the domain and plot it.
bathy_plot.py
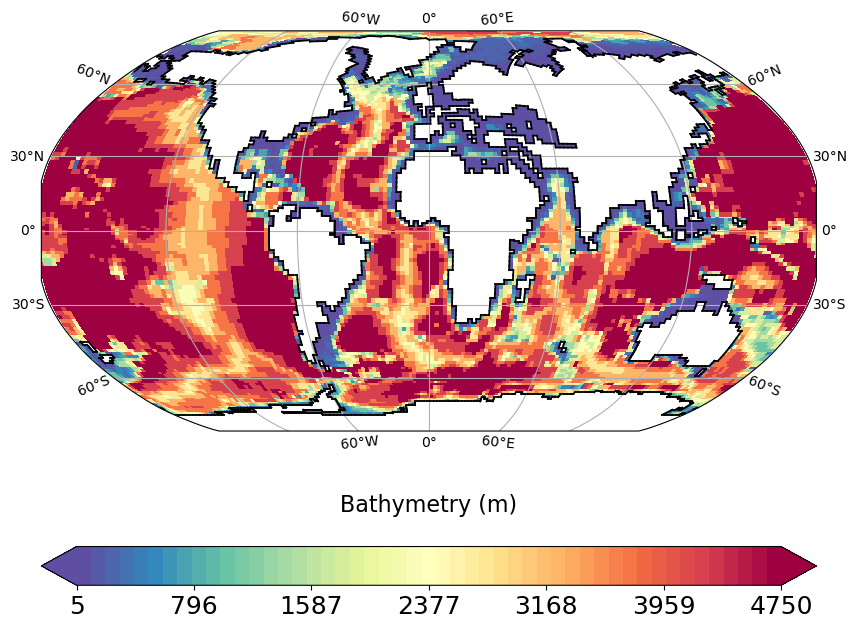
Plots bathymetry computed from thetao and deptht variables in grid_T file.
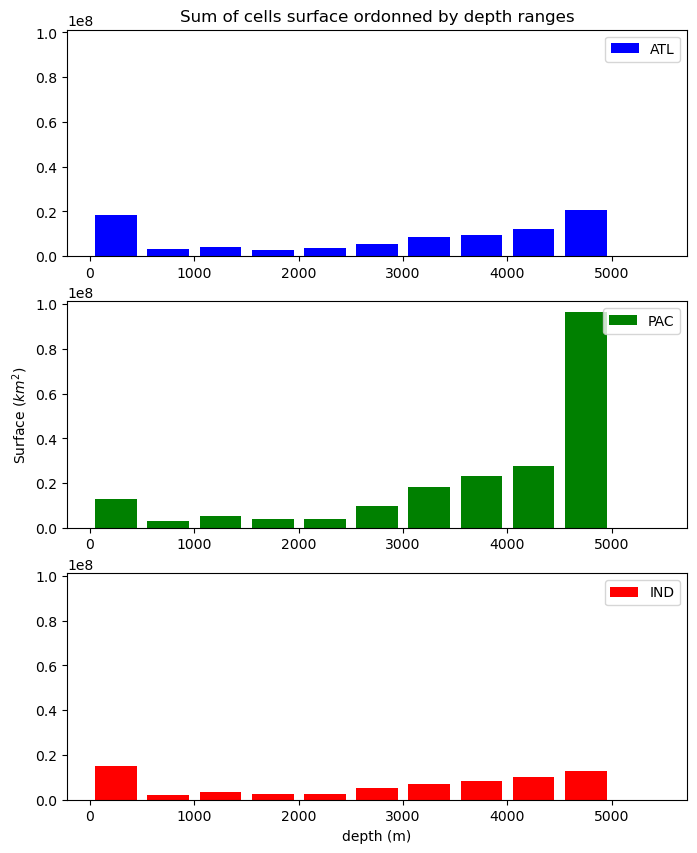
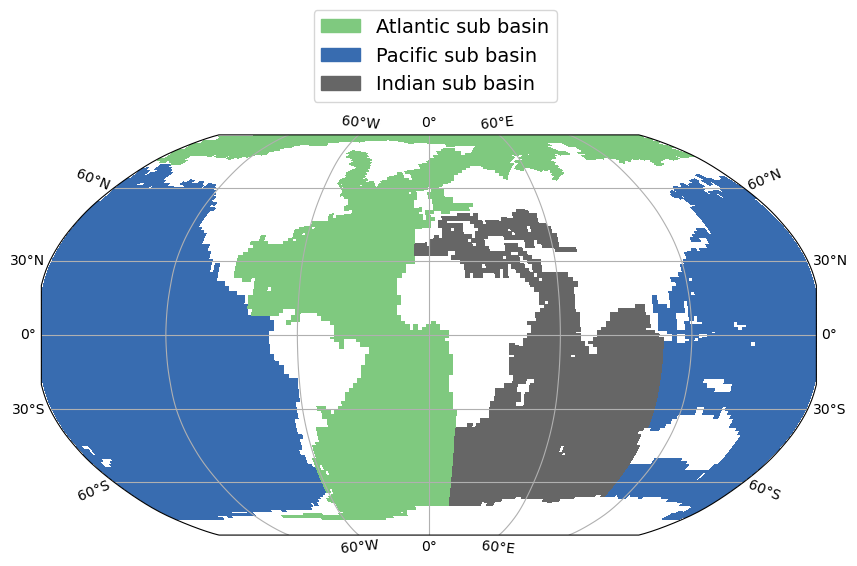
Then plots histogram showing sum of cells surface ordonned by depth bins (500m reange each) for each subbasin (atlantic, pacific, indian).
O2_Compute.py
Compute saturated O2 from O2 variable in ptrc_T file. The three variables created (oxygen_4, O2_SAT4, AOU4) can then be visualized with horizontal_section_plot.py or vertical_section_plot.py scripts.
gif_atm.py
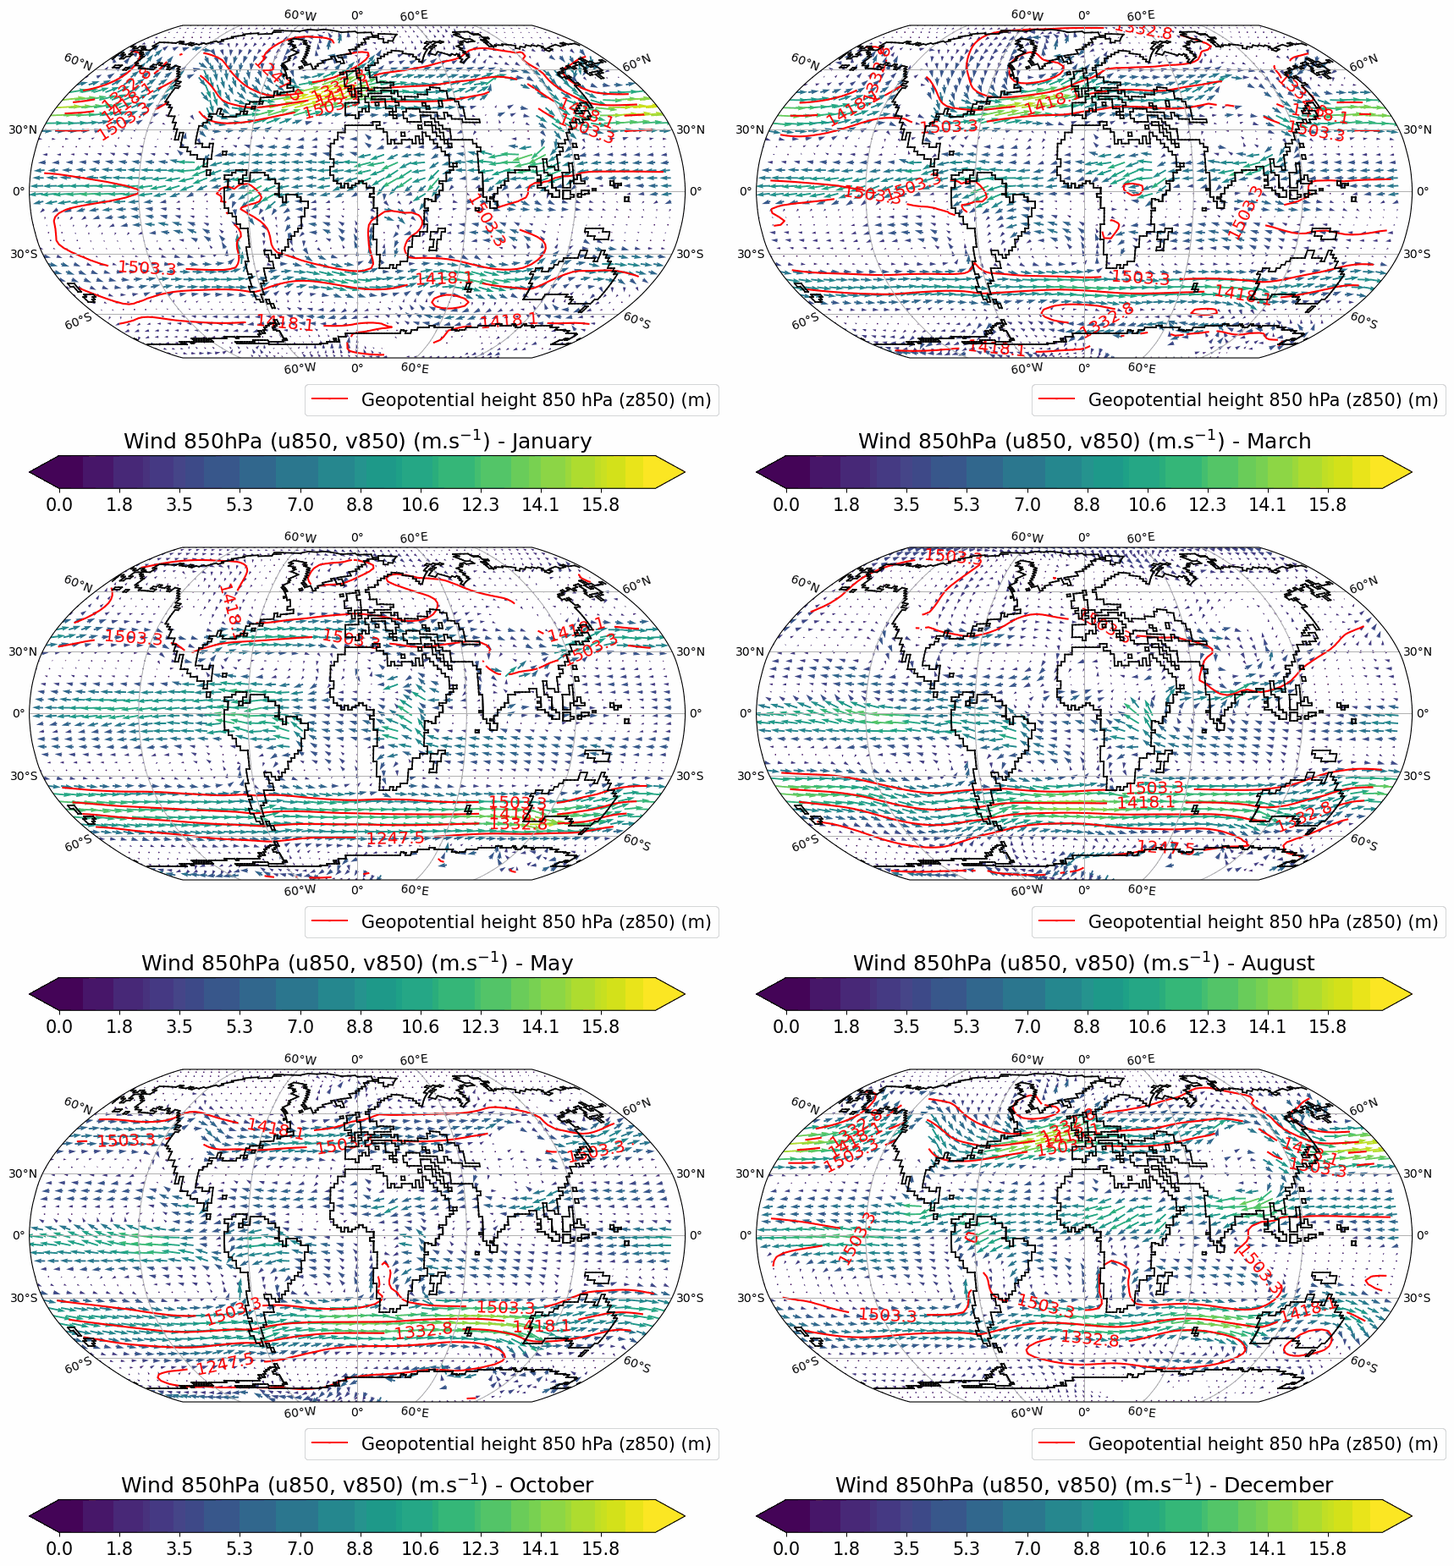
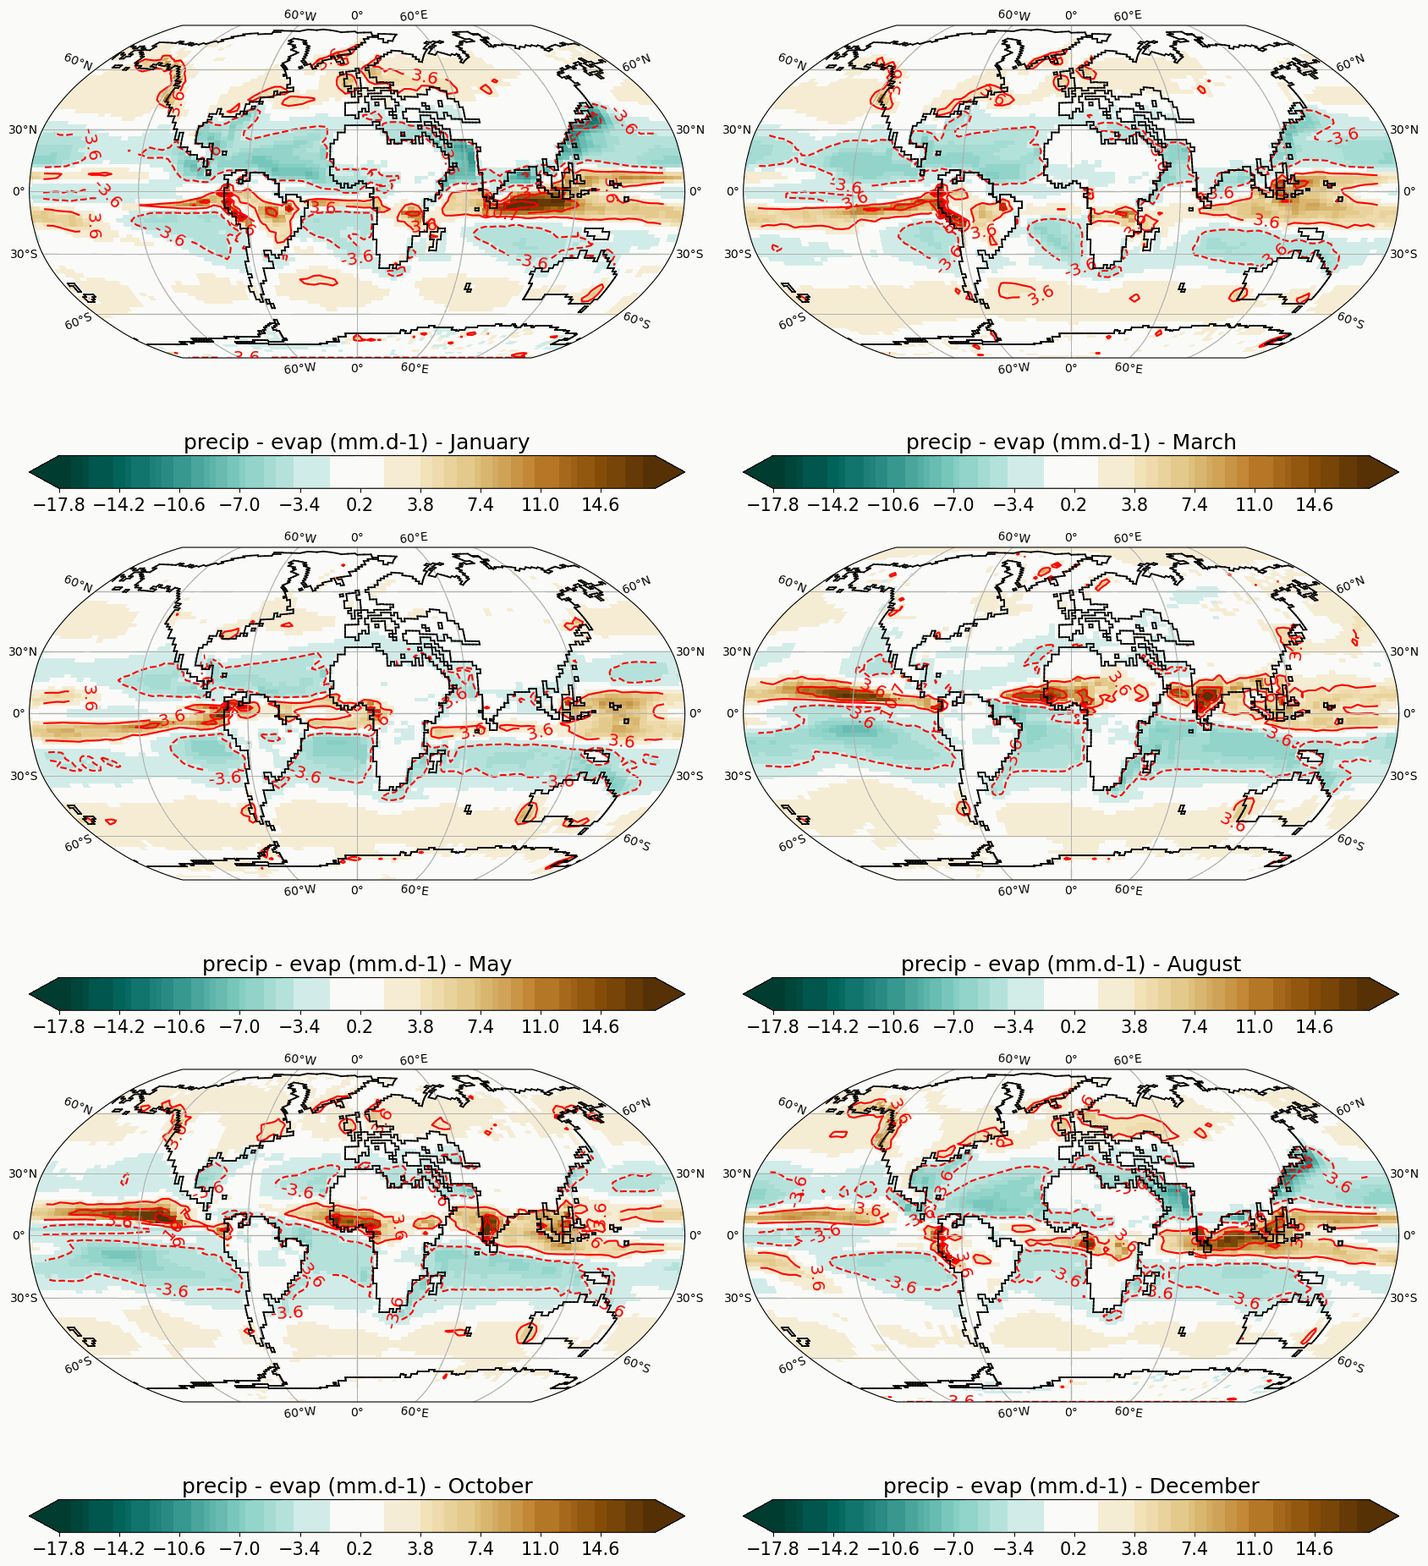
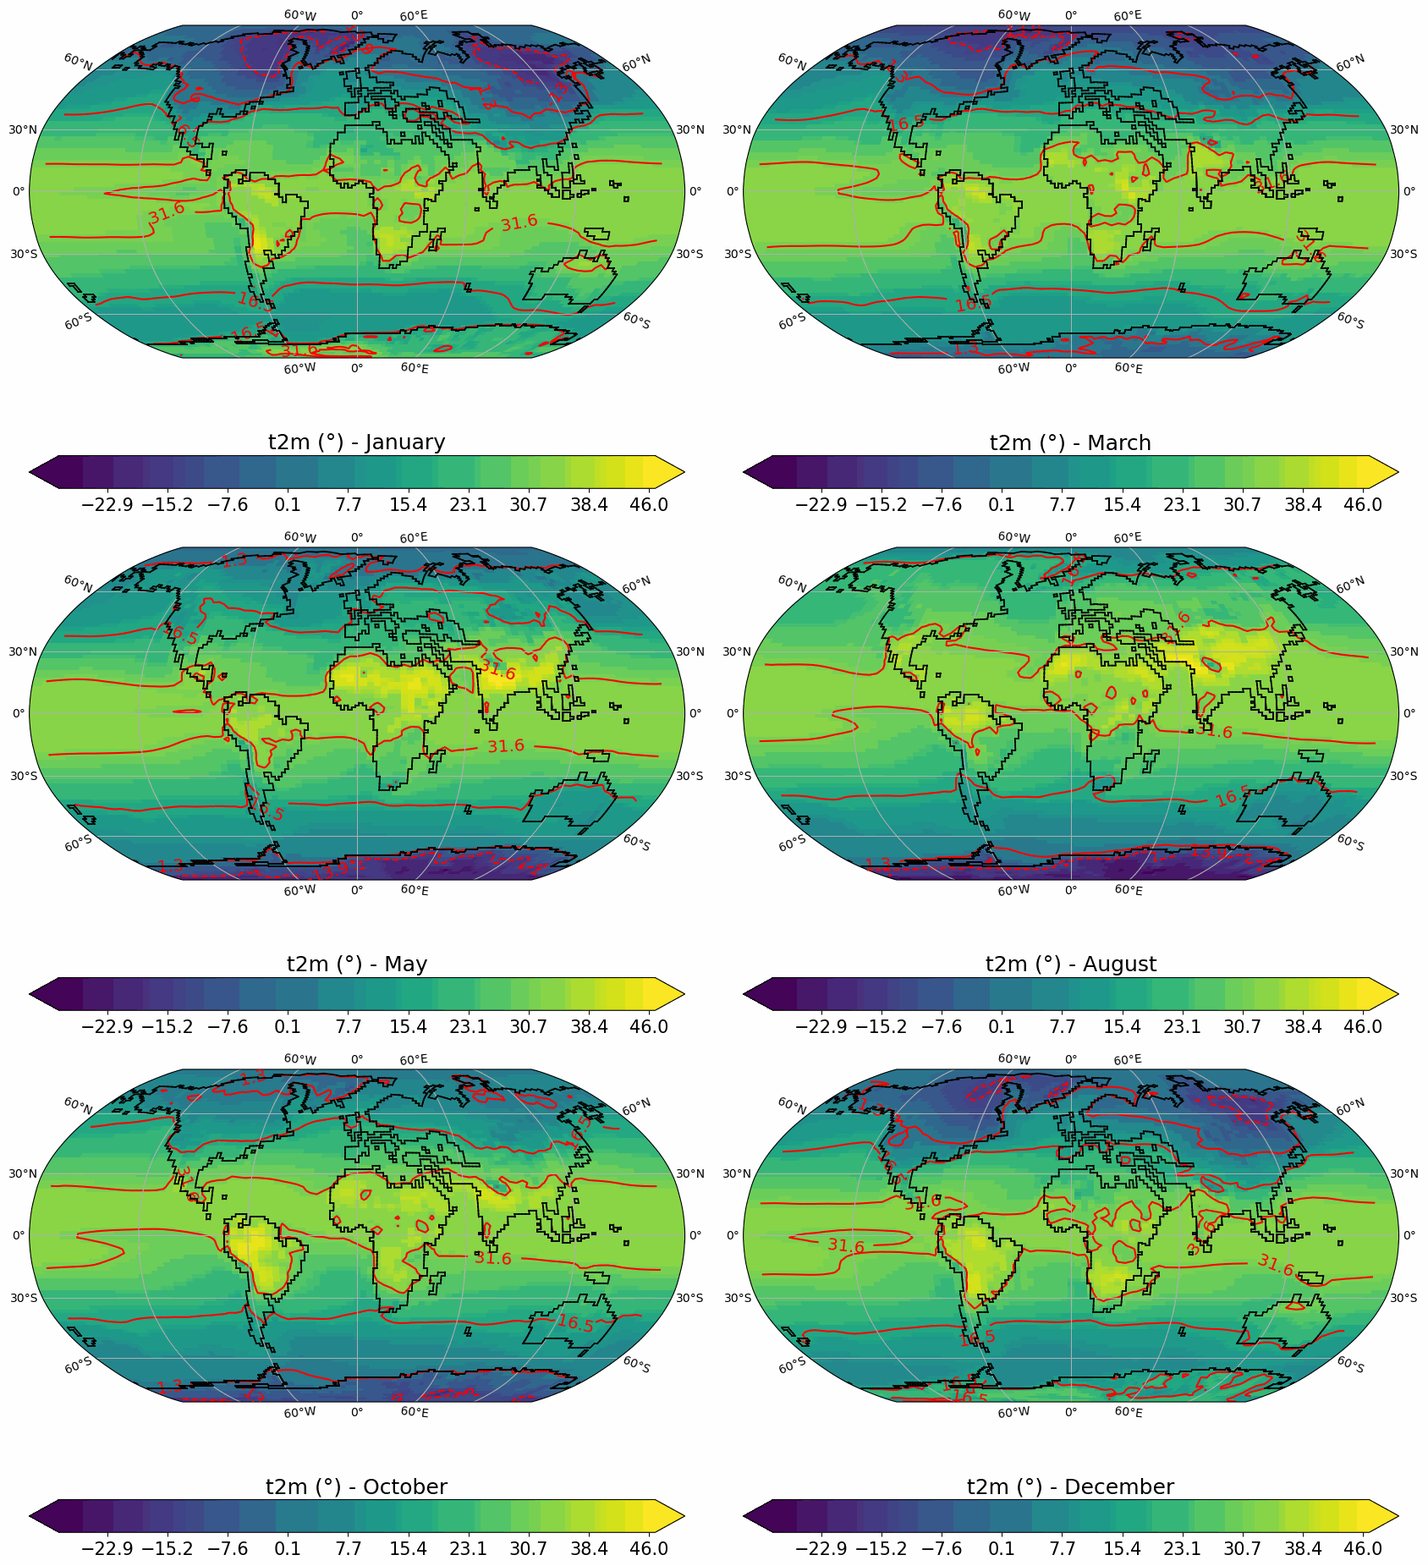
Generates animated gif of lon/lat plots for wind at 850hPa, Precip-Evap and T2M.
